
glo™ website redesign: how fixing usability issues increased business conversion by 22%
What opportunities does the ESR approach open up for business? And why is it a must-have for creating customer-centric e-commerce in 2024? The answers to these questions knows Denys Studennikov, COO and Head of the UX/UI Department at Turum-burum.
Taking the glo™ website redesign case study as an example, we will show how advanced analytics can identify interface issues and transform them into growth points to increase conversion and drive company efficiency.
Disclaimer: We are not advertising glo™ products or the glo™ brand, but we are using examples of the website's interface to showcase the work done by Turum-burum studio.
Getting acquainted with the glo™ brand: choosing redesign approach
glo™ is a brand of BAT, which produces tobacco heating devices* that allow you to consume nicotine without creating ash and burning**.
*Tobacco-containing heating products are not completely safe and are addictive.
**Heats tobacco without burning. This product does not eliminate all risks and contains nicotine, which is addictive.
Although the glo™ brand and its products are popular in Ukraine, the company wanted to improve the functionality of the UX/UI design of its online store. With this request, the glo™ representatives addressed the Turum-burum team.
Since the glo™ website had brand identity that was widely-known among users and functioned as a well-established mechanism, we chose the website redesign using ESR (Evolutionary site redesign) approach.
It involves implementing step-by-step changes to the interface to improve the website’s usability and increase the company’s conversion. Thus, instead of creating a new site from scratch, we use analytics to identify the shortcomings of the current website interface and fix them by applying CRO tactics to increase e-commerce conversion.
The first stage of the ESR approach is a website UX audit. It helped us discover the following::
- Not correctly configured data collection tools, so we couldn’t accurately analyze user interaction with the website. Consequently, we couldn’t take relevant decisions on interface changes and track their impact on KPIs;
- The website had numerous usability issues that had a negative impact on key website metrics.
Switching to Google Analytics 4: fixing setup issues for a glo™ website
After the glo™ team transferred the website’s data from Universal Analytics to Google Analytics 4, they noticed that the accuracy of collected data had decreased. Therefore, another Turum-burum task was to check all the analytics settings and eliminate possible causes of inaccurate indicators.
Working on analytics settings, the Turum-burum team:
- Worked out a user journey map to determine which flows users can take while interacting with the website. This allowed us to trace each step of potential customers and identify flows that need to be improved: simplified, shortened, etc.
.webp)
- Developed a scheme of events and parameters to overlay them on user journey maps. It allowed us to track the behavioral patterns of website visitors at each stage of their interaction with the platform.
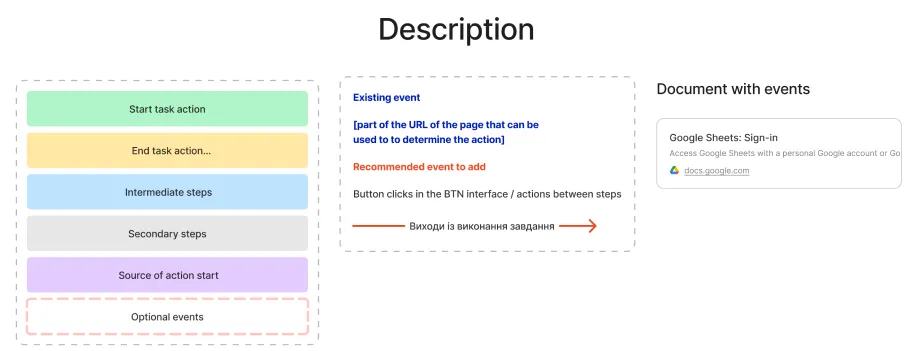
- Based on the data obtained about each flow, we found the stages of the funnel where users most frequently leave the website. Accordingly, we identified potential growth points of the company's conversion.
For example, after comparing different user flows, we found out that the subscription page is the most effective for buying sticks – 17% of users add products to the cart, and 37% make purchases from it, while only 1% of visitors add products to the cart and 68% buy products from the account page.
So, as we can see from the example, a number of the website's pages required optimization and usability improvements. This is the key to achieving the project's main goal: increasing business conversion.
Key website usability mistakes and recommendations for their elimination
During the UX audit, we found more than 80 usability mistakes that could lead to low KPIs. Based on the analytics, our experts formed hypotheses for improving the identified usability issues to create a more customer-centric interface and optimize website conversion.
At the next stage, we developed prototypes of the future glo™ website based on the analytics and hypotheses. Then we presented these prototypes to the business owners. Such an approach minimizes financial and time risks, since the stakeholder can see future interface changes and personally approve them.
Below you will find the examples of critical usability mistakes revealed by Turum-burum team and our recommendations for fixing them:
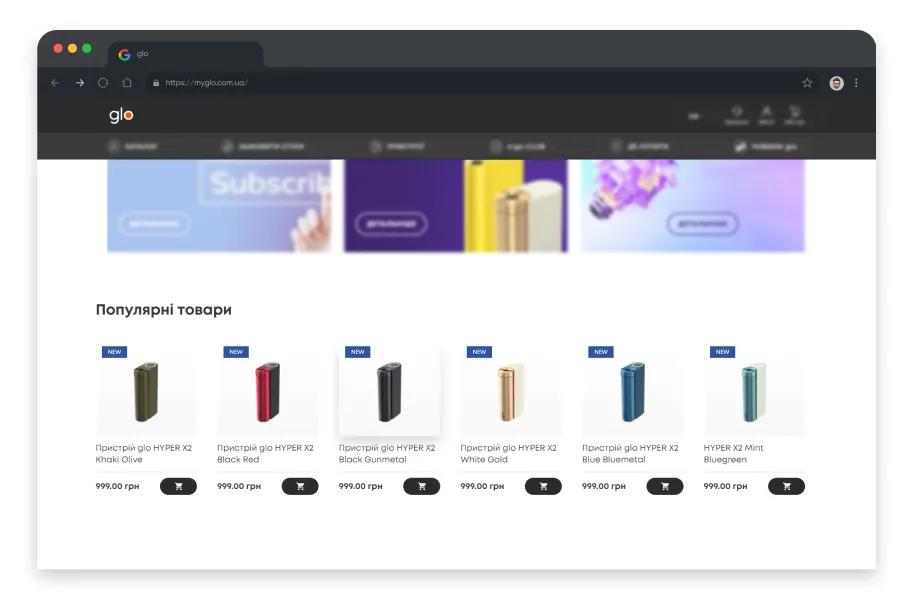
- Home page: poor engagement of regular customers
The problem: Although the majority of people who visit the site through the homepage are regular customers, the homepage of the glo™ website was not adapted for this category of users.
Moreover, the usability audit revealed low scrolling and interaction rates with the website's elements. It may indicate that the home page doesn’t cope with its main task – encouraging users who already have a glo device to buy new products and upgrade their current device.
There were also no additional blocks with accessories or related products that could increase the user experience by providing the opportunity to personalize and style owned devices.
Disclaimer: “This product does not eliminate all risks and contains nicotine, which is addictive.”
Recommendation: Since 88% of online shoppers surveyed in 2022 said personalization increases the likelihood they will continue their interaction with a website, it is pivotal to adapt glo™ homepage to the interests of regular customers.
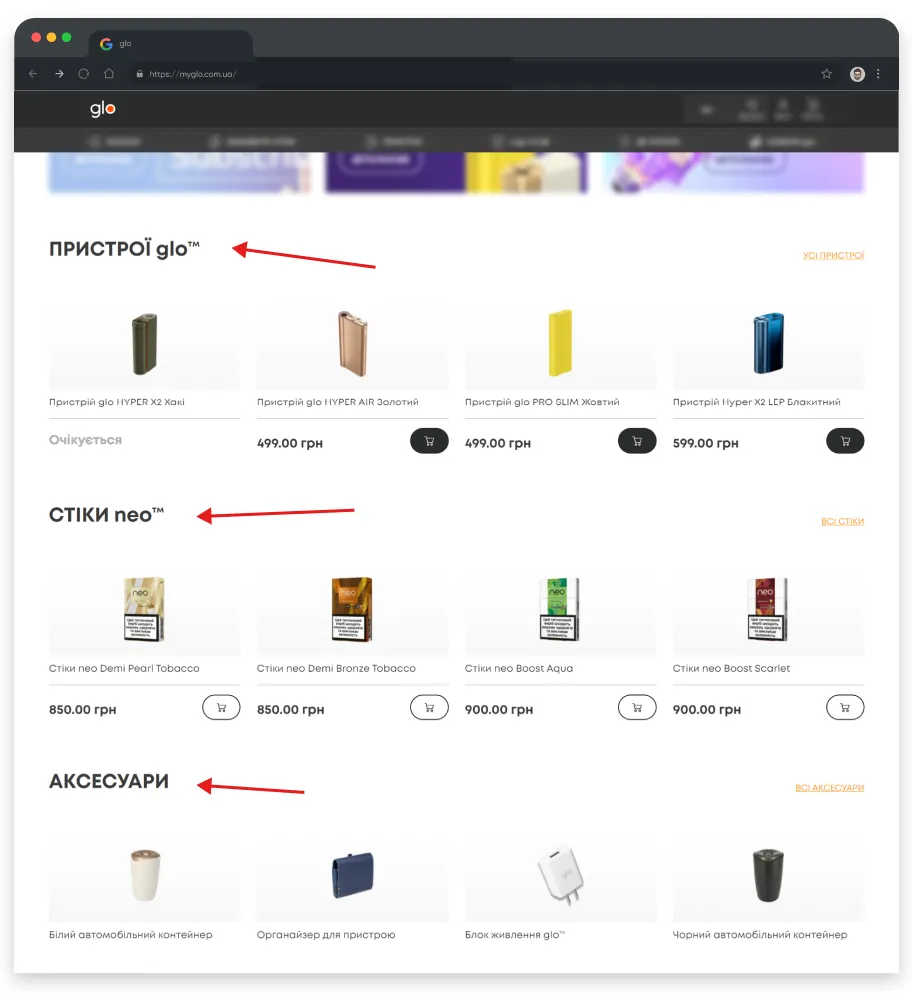
So we suggested adding an accessory block and displaying a list of different product models instead of showcasing 6 identical ones. In this way, we encourage users to upgrade and personalize their device and increase business conversion.
Disclaimer: “This product does not eliminate all risks and contains nicotine, which is addictive.”
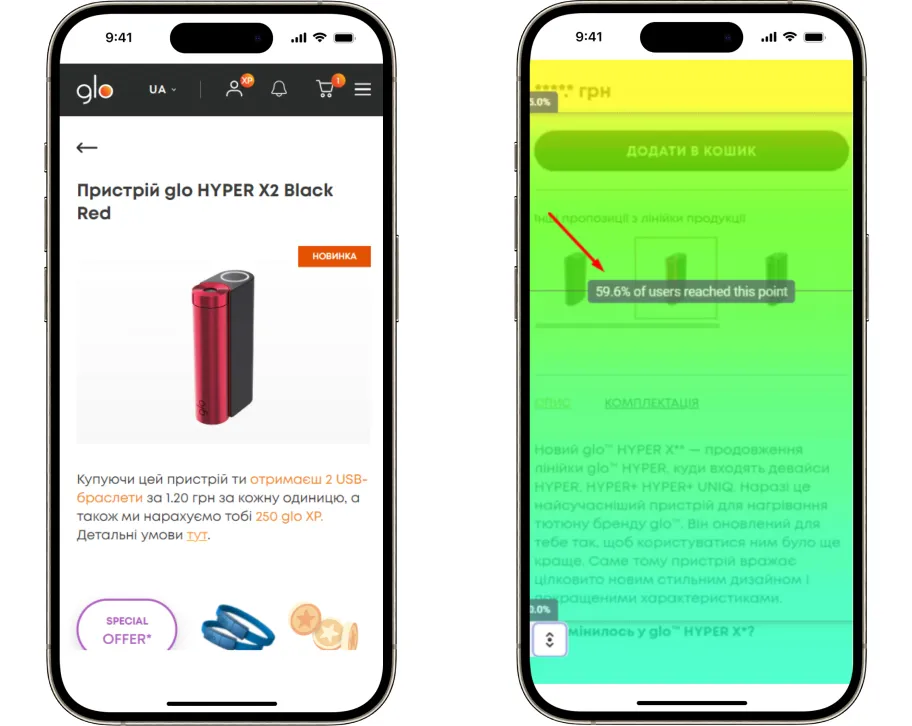
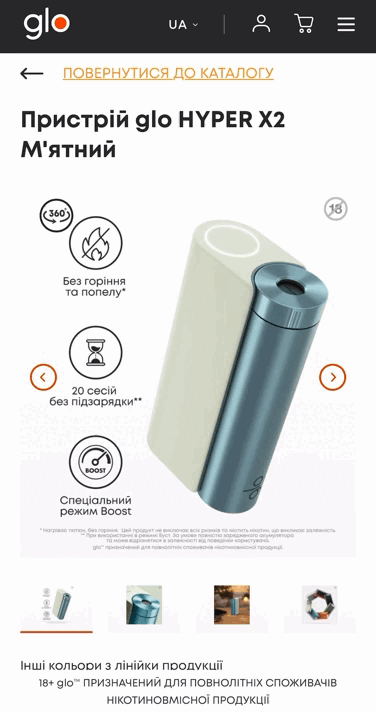
- Product card: inconvenient option to choose the color of the product
The problem: Device color is important for customers, who usually browse and compare all product options before adding them to the cart. At the same time, heatmaps of the glo™ product detail page showed that 40% of users did not view the selected product in other colors and left the page.
It was so because users had to scroll down the page for a long time, after which it would reload, to select the desired color. This process was time-consuming and customers couldn't quickly compare products in different colors, which was annoying for them. As a result, the bounce rate was high, which directly affected the conversion rate.
Disclaimer: “This product does not eliminate all risks and contains nicotine, which is addictive.”
Recommendation: Simplify the color selection option by:
- placing photos of all product colors in the gallery;
- raising the color indicators higher and placing them next to the product photo.
We also recommended reducing the loading time of photos that present products in different colors, since statistics show that pages with a loading time of 0-2 seconds usually have higher conversion.
Disclaimer: “This product does not eliminate all risks and contains nicotine, which is addictive.”
The result: According to analytics, after the redesign of the product card, the number of page reviews (product glo-hyper-x2-black-red) per session increased by 21.5%, the conversion rate when landing on these pages by 97%, and revenue by 19%. In addition, the number of new users who added products to the shopping cart from the product card doubled.
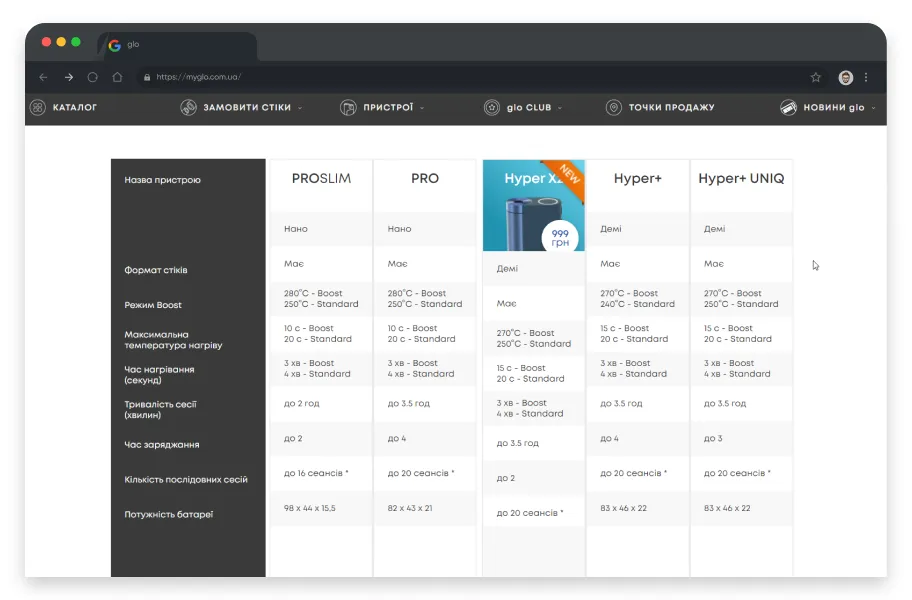
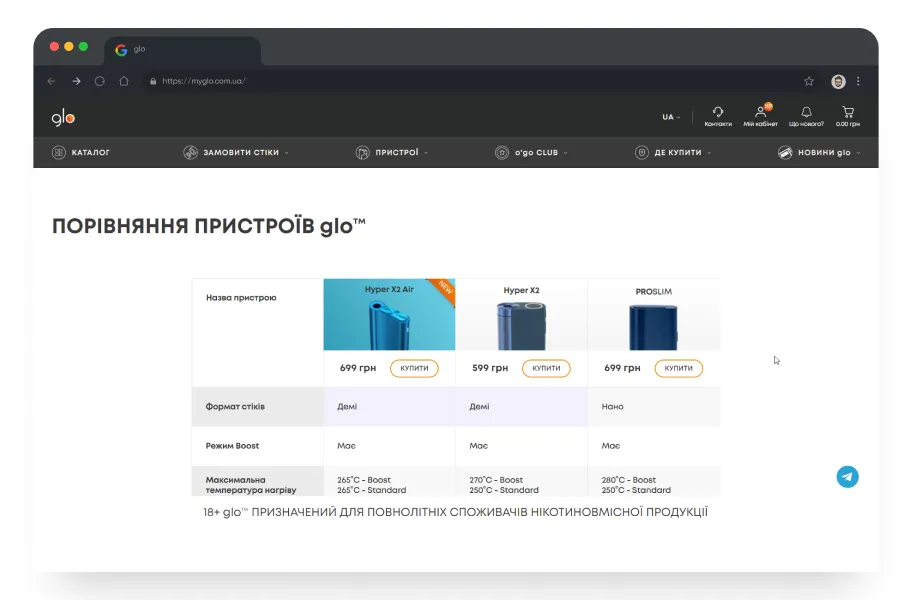
- Product comparison: impossible to purchase the selected product quickly
Problem: The page with the product comparison table had several drawbacks: not all items contained photos, it was difficult to find the price, and there was no button for adding the selected product to the cart. Therefore, if users decided to make a purchase at this stage, it was difficult for them to navigate further – it took a long time to find relevant models in the menu or catalog. This resulted in outflow of potential customers and a decrease in conversion.
Disclaimer: “This product does not eliminate all risks and contains nicotine, which is addictive.”
Recommendation: Add a “Buy” button directly below the product’s name and photo, or make product comparison cards clickable so that users can go to the page, read the detailed product characteristics, and add it to the cart.
Disclaimer: “This product does not eliminate all risks and contains addictive nicotine.”
The result: Thanks to the implementation of the mentioned recommendations, the number of pages viewed per session increased by 75%, and the average time spent on the site increased by 43%. In addition, the page bounce rate decreased by 49%.
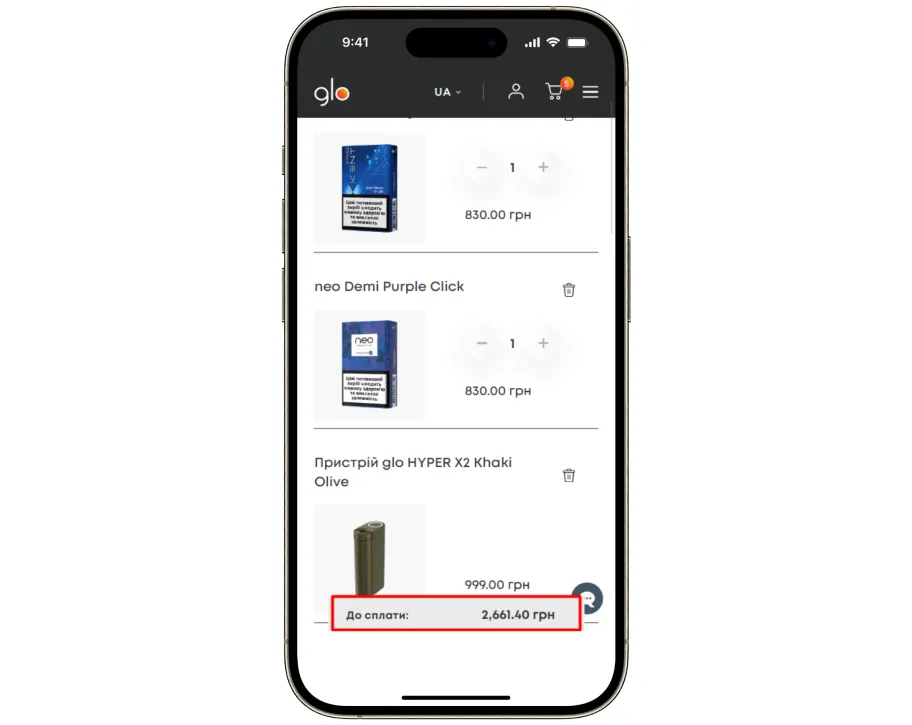
- Shopping cart: wrong accents that resulted in a high bounce rate
The problem: The cart page showed the total price of the order, but there was no fixed button leading to checkout, and users had to scroll to find it.
In addition, the “Clear Cart” link on the screen was the most eye-catching since it was in a contrasting color. Because of this, users could mistakenly clear the cart, thinking it is a button to open a checkout and not complete the purchase.
Disclaimer: “This product does not eliminate all risks and contains nicotine, which is addictive”
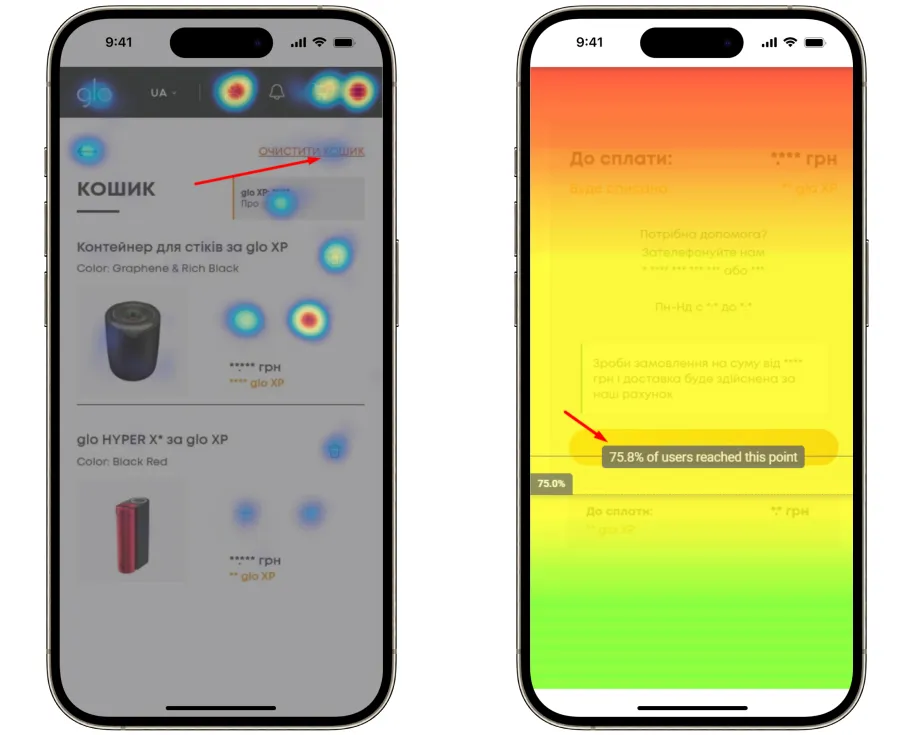
Recommendation: Fix the checkout button on a scroll and shift the emphasis to it to encourage users to complete the purchase.
.webp)
Disclaimer: “This product does not eliminate all risks and contains nicotine, which is addictive”
ESR glo™ website redesign: main achievements
When working on the glo™ website optimization, our team focused on two major tasks:
- Setting up data collection tools to get more precise analytics;
- Detecting website’s usability mistakes based on improved analytics and providing recommendations for their elimination.
Such a comprehensive approach allowed us to trace different user flows for performing a targeted action, identify potential growth points, and provide hypotheses for eliminating the website’s usability issues.
As you can see, advanced analytics is the key to creating a customer-centric website. Since setting up data collection tools correctly may be challenging, business owners shouldn’t rely on plugins. Instead, they should seek help from skilled experts.
So, within two months after the launch of the new website’s version, we got the following results:
- Conversion rates for landing on product cards increased by 87%;
- Conversion of users who viewed the glo™hyper x2 desktop device pages increased by 131%;
- Conversion for new users increased by 22.31%.
The latter metric clearly proves that we managed to improve the website’s usability and accessibility, as new users have not yet got used to working with the website and navigate intuitively.
Such results indicate the importance of UX audit for creating a customer-oriented website interface and confirm the statistics that every dollar invested in improving website usability can bring a business x10 profit.
Share this post on:


More real-world Turum-burum cases?
Review our vast portfolio of cases in a variety of business fields to make sure of our expertise.
Go to Portfolio
